... from an idea to superior design performance with mathematical modelling and engineering analysis ...
Simulation of breaking waves and associated loads to off-shore structures
Offshore wind farms located in a shallow water environment and in areas prone to hurricanes
may experience extreme breaking waves. Although little is known about their characteristics,
breaking waves may represent a dominant load that a wind turbine structure is subjected to
during its design lifetime. Existing analysis approaches may have limited applicability,
especially for large structures.
The objectives of the conducted study were to:
create a computational (CFD) environment of a wave tank (wave generation and propagation
with minimum dissipation, wave breaking initiation and wave termination without reflection)
perform CFD simulations of wave behaviour in an intermediate and shallow depth water
environment and to validate the computational results against published experimental data
perform CFD simulations of wave slamming on a cylindrical monopile for previously
studied wave conditions
statistically evaluate the simulation results to obtain the time variation of breaking
wave forces and associated moments
The modelling analysis was performed with ANSYS CFX and Fluent. The heterogeneous
multiphase model was used in CFX, and the homogeneous multiphase model with Volume-of-Fluid
and Level Set method in Fluent. The simulation domain was 1500 m long with the water depth of 54 m.
Waves were generated with a flap type wave generator [1]. Their initial height was 13.6 m and
the wave length 248 m.
Visualisation of breaking waves on a monopile
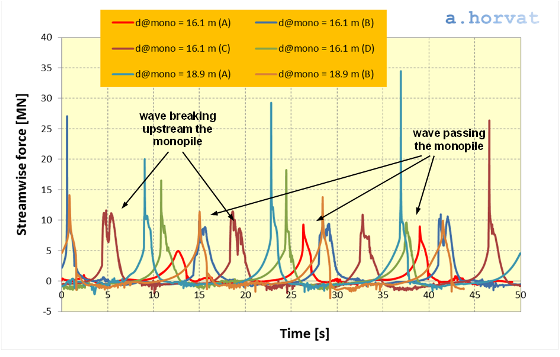
Time variation of the streamwise force was calculated for a monopile with the diameter
of 6 m. The diagram shows individual records divided into 50 s time intervals.
Recorded variation of the wave streamwise force acting on the monopile
When the wave breaks at the monopile, the force the monopile is subjected to is the
highest. It is significantly reduced if the wave breaks before or after the monopile.
Single peaks in the force diagram mark waves passing the monopile before breaking,
whereas groups of multiple peaks identify breaking waves upstream of the monopile. The diagram
shows that the peak wave forces range between 5 and 34 MN.
The height of breaking waves was compared with the experimental data collected by Battjes [2]
and a good agreement was demonstrated. The calculated forces to the monopile were also compared to
the empirical correlation used by IEC guidelines [3]. Although, the force amplitude is identical and
determined by the wave height, the CFD simulation shows the force variation and duration that cannot
be captured by the empirical correlation.
References
P. Frigaard, M. Hogedal, M. Christensen, Wave Generation Theory, Hydraulics & Coastal Engineering Laboratory, Aalborg University, June 1993.
J.A. Battjes, Computation of Set-Up, Longshore, Currents, Run-Up and Overtopping due to Wind-Generated Waves, Ph.D. Thesis, Delft University, Netherlands, 1974.
International Electrotechnical Commission (IEC), IEC 61400-3 Ed.1, Wind Turbines – Part 3: Design Requirements of Offshore Wind Turbines, IEC TC 88 WG3 Committee Draft, December 2005.
Dr Andrei Horvat
M.Sc. Mechanical Eng.
Ph.D. Nuclear Eng.